Creating PID Tuning Graphs
Contents
Overview
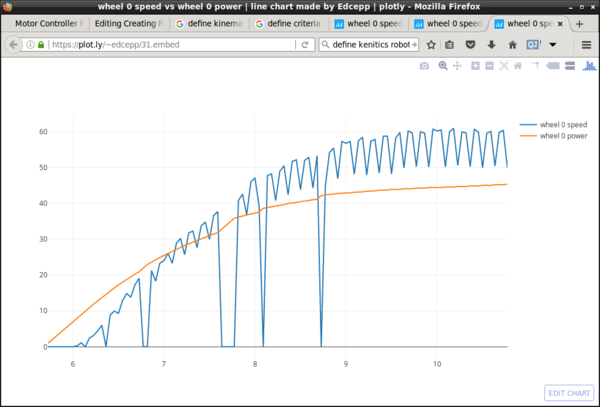
This page documents a Python program designed to graph the first few seconds of power applied to the motors and robot speed. It is used to help calibrate PID parameters.
I didn't know how to configure rqt_plot to scale the lines reasonable snapshots. For example, entering the follow command resulted in a wheel speed line that was on the zero x-axis because the count measurements dominated the smaller wheel speed measurements. This was solved with a custom Python program described below.
rqt_plot /cmd_vel/linear/x /wheels/data[1] /wheels/data[2] /phidgets/encoder/351547/count_change
Message Additions to the Motor Controller
Code
A "wheels" message of type Float64MultiArray is published in the setMotorPower function. It has five elements.
- data[0]: time is seconds since the motor controller was started.
- data[1]: wheel 0 speed in m/sec
- data[2]: percent of full power applied to wheel 0
- data[3]: wheel 1 speed
- data[4]: wheel 1 power
Wheel published global declaration
   ros::Publisher wheel_pub_;
   ros::Time beginning_time_;
Publisher initialization in the main.
wheel_pub_ = n.advertise<std_msgs::Float64MultiArray>("wheels", 100);
Initializing beginning time in InitMotorPower
beginning_time_ = ros::Time::now();
Publishing a wheel status message in setMotorPower
    std_msgs::Float64MultiArray wheel_data;
    wheel_data.data.clear();
    ros::Time odom_time(odom_.header.stamp.sec, odom_.header.stamp.nsec);
    ros::Duration elapsed_time = odom_time - beginning_time_;
    wheel_data.data.push_back(elapsed_time.toSec());
    wheel_data.data.push_back(wheel0_speed);
    wheel_data.data.push_back(power_wheel0_);
    wheel_data.data.push_back(wheel1_speed);
    wheel_data.data.push_back(power_wheel1_);
    wheel_pub_.publish(wheel_data);
Message Reference
General
- General Messages Primitive Data Types in Messages
- Common Messages ROS Specific Messages
- Standard Messages Primitive Data Messages
Float Array Specific
- 64 bit float array messages Message Detail
- Array message layout
- Array message example
Time
The Python Plot Code
Plot termination Criteria
There are two termination criteria 1) cnt-c and 2) time. After one of the criteria is met, the graph is drawn.
Plotly Graphing Tools
Installing
 sudo apt-get install python-pip
 sudo pip install plotly
Authentication
See authentication file in
~/.plotly/.credentials
Authentication statement in Python code
plotly.tools.set_credentials_file(username='xxx', api_key='yyy')
Coding
Working around a bug in iplot. Change it to plot.
Code
Execution
This is done under load - the robot is on the floor and running.
Terminal 2 - Start up the motor controller with new pid parameters
roslaunch floor_hugger motor_control_nav.launch
Terminal 3 - Start up odometry
roslaunch floor_hugger odometry.launch
Terminal 4 - Collect 8 seconds of data and save the plot on the plot.ly site as 153020pidplot. ^c to create graph or wait for 8 seconds for the program to terminate.
 python pid_graph.py 153020pidplot 8
 ^c
Terminal 5 - Publish continous cmd_vel Twist meassages. ^c to terminate and stop motors.
 python motors_go_full.py 0.2 0.0
 ^c
Example Graph
These measurements are under load.
Setting
- P = 15
- I = 15
- Target speed 0.2 m/sec
Observations
- Notice the odometry glitches that report a 0 m/sec wheel speed. See Odometry Glitches.
- It also suggest a power dead zone from 0 to 10%.
